Boundary Review Update and Community Listening Session Dates
Dear Families, Staff, and Community Members,
Thank you to everyone who took the time to participate in the Redmond School District Boundary Review Survey. Your feedback is a critical part of this process, and we appreciate your engagement and thoughtfulness. The Redmond School District is in the process of assessing school zone boundaries in order to adjust for changing school populations. Unequal residential housing development throughout the district have caused an increase in enrollment at some schools while maintaining a steady enrollment at other schools. In collaboration with members of the Redmond School District community, we will assess our school boundaries. Final recommendations to the Superintendent and Board of Directors will occur in the spring. Redmond School District is partnering with MGT to provide updated data-driven student enrollment forecasts and develop draft boundary scenarios.
Guiding principles for boundary adjustments include:
1. Balance utilization at the current, 5-year, and 10-year forecasted trends.
2. Minimize the number of students impacted by boundary adjustments.
3. Maximize proximity to home/walkability (e.g., not having to cross busy streets, railroad tracks, and consider natural boundaries).
4. Make efforts to maintain the feeder system.
5. Consider transportation impacts, and work towards limiting the amount of time required on a bus.
6. Minimize disruption and impacts to special programs or special populations (e.g., multilingual learners, economically disadvantaged, special education).
We invite you to continue participating by attending one or both of our upcoming Community Listening Sessions:
-
Boundary Review Community Listening Session
When: Monday, March 16 | 5:30–7:30 p.m.
Where: Tom McCall Elementary (Gym/Commons) -
Boundary Review Community Listening Session
When: Tuesday, March 17 | 5:30–7:30 p.m.
Where: Sage Elementary (Gym/Commons)
Elementary School Attendance Areas
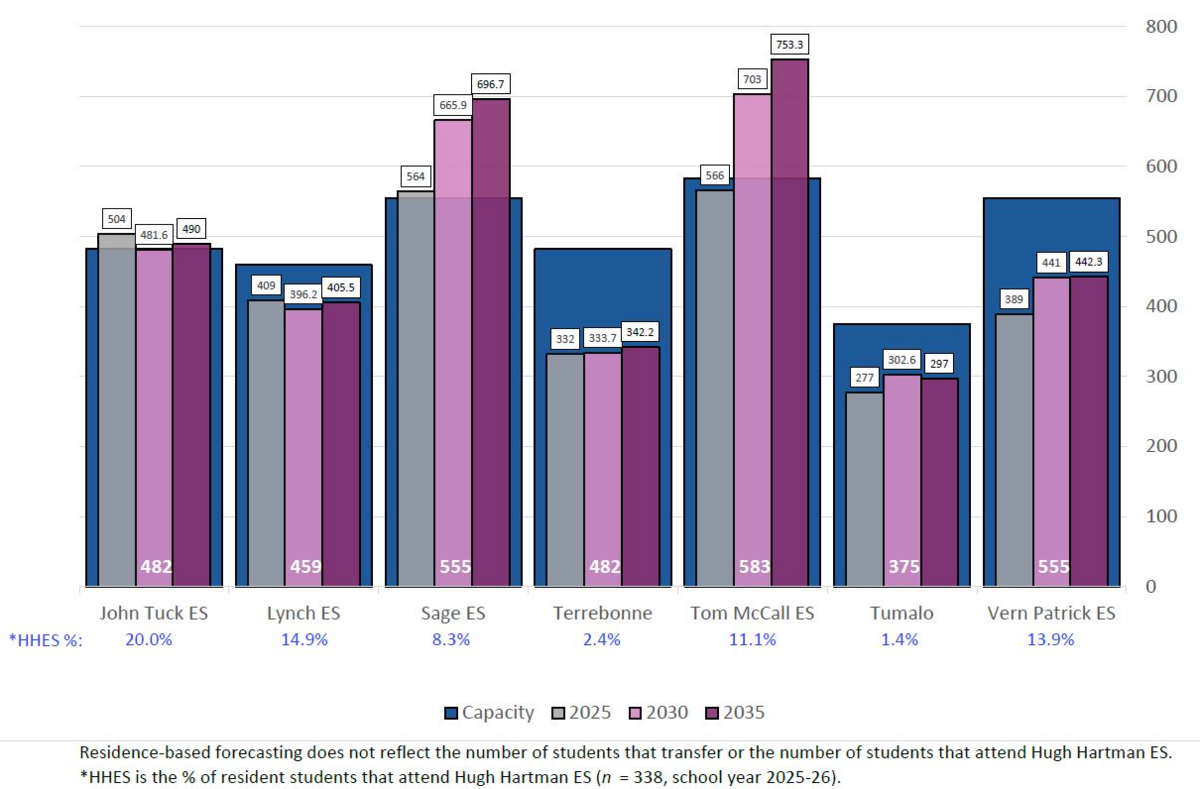 The above graph displays the utilization percentages for each attendance area for the 2025-2026 base school year and predicted utilization for the 2030-31 and 2035-36 school years. The dark blue represents the capacity of each school and the bars represent the number of students residing within the attendance area for the 2025-2026 school year (gray bar) as well as the number of students predicted to reside in each attendance area in school years 2030-2031 (pink bar) and 2035-2036 (purple bar).
Sage and Tom McCall are projected to exceed their building capacity based on resident student growth in future years. Sage is expected to experience continued growth, reaching approximately 120 percent of its capacity in 2030 and 126 percent in 2035. Tom McCall is projected to be 121 percent of its capacity in 2030 and 129 percent in 2035. In contrast, Terrebonne and Vern Patrick are predicted to be below capacity throughout the forecast period even with some growth in resident students within the Vern Patrick attendance area.
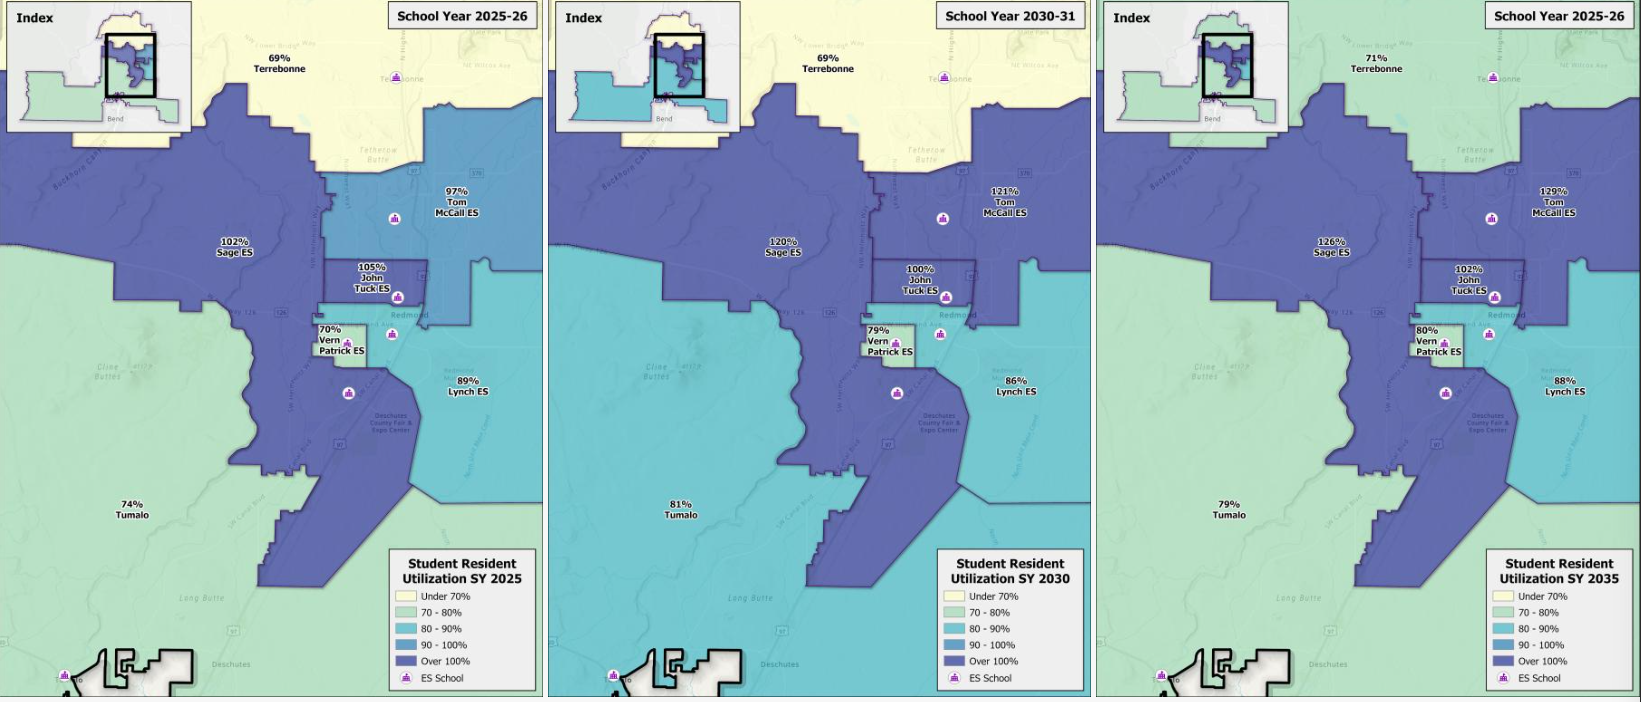 These maps highlight attendance areas that are overutilized (darker colors) and others that are underutilized (lighter colors) for the current, 5-year, and 10-year forecast horizons, see color ramp below. Please note the percent utilization is based on the number of students that reside (or are predicted to reside in the future) within each attendance area. Elementary school attendance areas with residence-based utilization percentages for the 2025-2026 base school year and predicted residence-based utilization for the 2030-31 and 2035-36 school years.
We understand that boundary adjustments can be a difficult and emotional process for families and staff. Our commitment is to approach this work thoughtfully, transparently, and with student well-being at the center of every decision. Thank you for being an active partner in shaping the future of our school community.
Redmond School District